
I recently came across an article that says it’s performance appraisal time. That all depends on what schedule your company has for performance appraisals—and how well your boss meets that schedule.
Regardless of the schedule, you need to be collecting data and tracking your numbers so that you can make yourself look great for your next performance appraisal. Don’t wait until a week before you meet with your boss to do this. Tracking your results is an ongoing process.
“I don’t need to track my results,” you may be thinking. “My boss knows what great work I do.”
Wrong.
Most bosses know what you’re up to, but they generally don’t track your numbers unless you’re in sales. Also, most bosses have more than one direct report unless they’re in a really small company. If you’re in a really small company, people are wearing lots of hats and your boss is probably overwhelmed.
Also, your boss may be focused more on his/her performance than yours, because bosses get performance appraisals, too.
It’s up to you to track the numbers that show what a superstar you are. In business, results count for a lot.
For example, if you’re a recruiter, you want to document your successful activities.
I recently coached a young professional about preparing for his performance appraisal. He didn’t realize that he needs to advocate on his own behalf, because his boss won’t know everything he’s accomplished. Like him, you need to know your numbers. And numbers can be used in so many ways.
“Trump Wins 35% of NH Vote” the headlines trumpeted. Good for the Donald. But what does the inverse of that represent? “Trump Loses 65% of NH Vote.” Were those NH voters demonstrating that they prefer the traditional politicians over Trump? Sure, that 65% of votes was split among several candidates, but what does the 65% represent?
If you had a less than stellar outcome on a project, what is the inverse way of looking at that? For example, maybe you were supposed to talk to X prospects so your company could open a new market. Perhaps you talked to 50% of your X, yet you heard from everyone you contacted that they did not have a need for your company’s services.
Those results could mean
Discuss these with your boss. Don’t use these as excuses for your performance. Explore with your boss what might really be going on.
I like percentages because they put a subject into a framework, they give context to the person interpreting the numbers.
For example, Bob in business development brought in 5 new clients. Is that good or bad? If Bob’s previous total of clients was 5, that means he took his numbers from 5 to 10—a 100% increase. Bob is rocking it.
But if Bob’s 5 new clients took his total from 95 to 100, Bob only showed a 5.2% increase. Unless he has just maxed out the market, Bob needs to look for a new job.
Our brains work in pictures, which supports the saying, “A picture’s worth 1000 words.”
The area graph below is from an investigation I worked on when I was with GAO (now Government Accountability Office). The focus of the investigation was the nuclear power operations of the Tennessee Valley Authority (TVA). TVA was running into significant financial problems due to the costs of building and operating nuclear power plants.
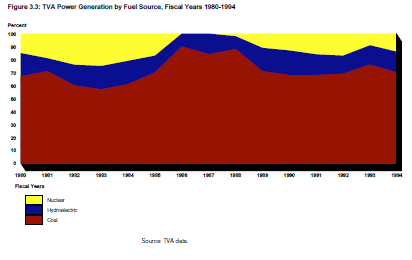
The yellow on the graph represents how much nuclear power TVA was producing from 1980-1994 (time frames for the study). The agency was in deep financial trouble because of the yellow, yet most of the power TVA generated came from hydroelectric (blue) and coal (brown). Would you run your personal budget that way?
Take your numbers and see how you can show impact by using a graph.
This is particularly appropriate if you work in communications, marketing, or business development. The infographic below, courtesy of Visual.ly, summarizes a lot of data in a clever way. Stretch your thinking and see what you can come up with for your performance appraisal.
Caveat: Remember that the audience for your infographic is your boss. Make sure what you create will work with him/her.
© Pamela A. Scott, MentorLoft, 2016
From Visually.
